What is a Nichols Plot ?
What is a Nichols Plot ?
Nichols Chart Definition
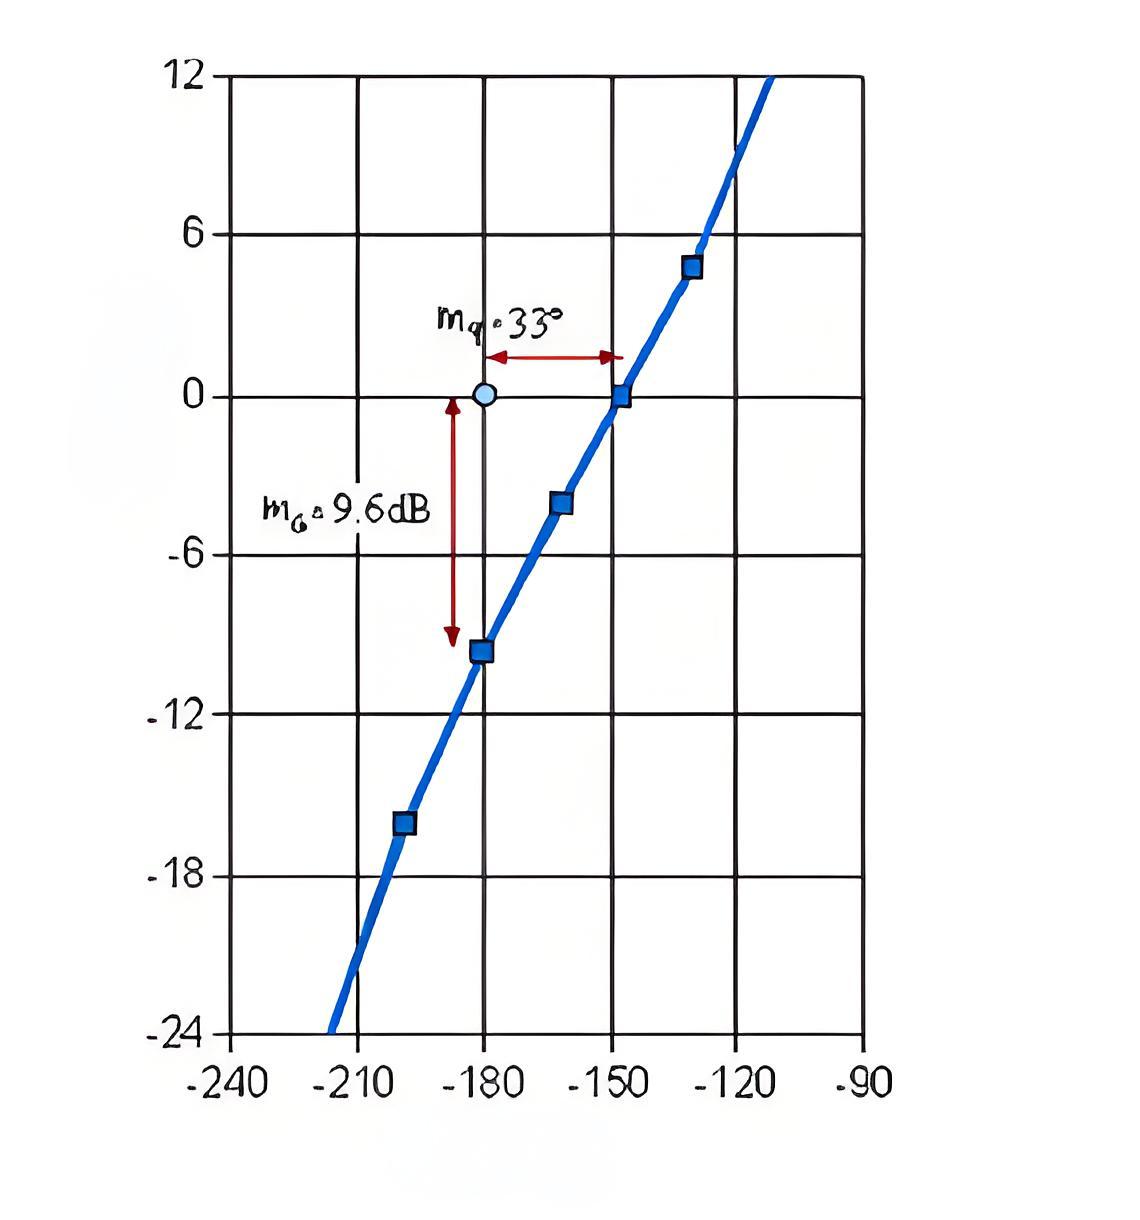
A Nichols Chart is a graphical representation used to analyze and design feedback control systems by depicting stability and frequency responses.

Functionality
The chart works by transforming complex frequency responses into a simpler gain phase plane, making it easier to analyze system behavior.
Applications
Nichols charts are particularly useful in designing compensators for devices like DC motors, emphasizing their role in practical engineering.
Advantages
One of the major benefits of using a Nichols chart is its ability to graphically determine gain and phase margins, facilitating adjustments to the system’s gain.
Challenges
Despite its usefulness, the Nichols chart can be less effective for minor gain adjustments due to the deformation of constant magnitude and phase circles.
Welcome to our electricity community! Established to facilitate the exchange and cooperation in the electricity industry and bridge professionals, enthusiasts, and related enterprises.


